

Abstract
INTRODUCTION
The aim of this study was to determine the effect of a high-fat diet (HFD) on oocyte maturation and quality in a mouse model.
METHODS
Female BALB/c mice were allocated to one of the following groups: (a) control group (n = 40), which received a controlled diet; or (b) HFD group (n = 40), which received an HFD for 12 weeks. Sections of the ovary were examined histologically. The number of follicles and corpora lutea were counted. In vitro maturation and in vitro fertilisation (IVF) were assessed in germinal vesicle (GV) and metaphase II (MII) oocytes, respectively. The expression of bone morphogenetic protein 15 (BMP15) and leptin receptor genes in GV and MII oocytes was evaluated using reverse transcription real-time polymerase chain reactions.
RESULTS
In the HFD group, there was a decreased number of primordial and Graafian follicles, as well as corpora lutea (p < 0.05). The rate of oocyte development to the MII stage was also reduced (p < 0.001). Cumulus expansion was observed more frequently in the control group than the HFD group (p < 0.05). The IVF rate in the HFD group was lower than that in the control group (p < 0.05). In the HFD group, BMP15 and leptin receptor genes were upregulated in the GV stage (p > 0.05) and MII stage (p < 0.05), compared to the control group.
CONCLUSION
An HFD reduces folliculogenesis in the primordial and Graafian stages, in vitro maturation and in vitro fertilisation rates, as well as oocyte quality in mice.
INTRODUCTION
Obesity is a worldwide problem that affects public health. In 2008, over 1.4 billion adults (i.e. persons aged ≥ 20 years) in the world were overweight (body mass index [BMI] > 25 kg/m2).(1) According to Kelly et al, if this trend continues, 57.8% of the world’s adults will be overweight or obese by 2030.(2) Based on statistics published by the World Health Organization in 2013, the incidence of obesity has doubled worldwide since 1980.(1)
Women are at a higher risk of obesity and this risk may increase with age.(1,3,4) While most obese women are not infertile, the negative impact of obesity on fecundity and fertility is well documented. Obese women have been shown to be three times more likely to suffer from infertility compared with women who have normal BMIs.(5) Another study showed that women with polycystic ovary syndrome and obesity have smaller oocytes than women in the control group; it also showed that when the women were further subdivided according to their BMI, both polycystic ovary syndrome and obesity were found to influence oocyte size, independent of one another.(6) In a study conducted by Wittemer et al, a decrease in the number of collected oocytes was observed in long stimulation protocol cycles when the BMIs of the women were ≥ 25 kg/m2.(7)
Defects in ovarian function that are associated with diet-induced obesity result in poor oocyte quality, reduced blastocyst survival rates and abnormal embryonic cellular differentiation.(8) It has been shown that raised BMIs contribute to worse outcomes for assisted reproductive techniques, including lower pregnancy and live birth rates, and a higher miscarriage rate. This could be due to the detrimental effect that elevated BMIs have on oocyte and embryo quality.(9) A study, which examined the effect of obesity on pregnancy via intracytoplasmic sperm injection, found that pregnancy rates were significantly lower in women with a BMI > 25 kg/m2; these women also had higher duration of ovarian stimulation, gonadotropin requirements and spontaneous miscarriages as compared to women with a BMI ≤ 25 kg/m2. Obesity could have been a risk factor for oocyte maturity, accounting for the increased doses of gonadotropin stimulation required by obese women.(10) Jungheim et al demonstrated that apoptosis was specifically increased and oocytes were smaller in the preovulatory ovarian follicles of obese mice; reduction in oocyte maturity was also observed.(11) In another study, Shah et al observed that obesity was associated with fewer normally fertilised oocytes, lower estradiol levels, and lower pregnancy and live birth rates.(12) Infertile women who require in vitro fertilisation (IVF) should be encouraged to maintain a healthy weight during treatment.(12)
Leptin is a 16 kDa small peptide that is secreted by adipose tissue. It is known to be associated with food consumption and the regulation of body weight, similar to the role of insulin in type II diabetes mellitus. However, leptin, which is produced within the ovary, also plays a role in the pathways that control reproduction, such as folliculogenesis.(13) Bone morphogenetic protein 15 (BMP15) is an extremely important oocyte-derived growth factor that is required for normal folliculogenesis and the female fertility of mammals. BMP15 is a member of the transforming growth factor beta (TGF-β) superfamily, and its mRNA and protein are found exclusively in the oocytes of most species.(14,15)
Obesity affects fertility in various ways (e.g. by impacting ovulation and the development of oocytes).(5) It is generally accepted that a high-fat diet (HFD) can be used to generate a valid rodent model for obesity. In the present study, we examine the effect of HFD on in vitro maturation (IVM), IVF and the expression levels of leptin receptor and BMP15 genes, using a mouse model.
METHODS
In the present study, we used 80 three-week-old female BALB/c mice. The mice were placed in cages (five per cage) under standard conditions – 12 hours light, 12 hours dark, 60% ± 5% humidity, 30°C ± 2°C temperature, with easy access to food and water – for one week. Thereafter, the mice were divided into two groups, the HFD group and the control group. For 12 weeks, the mice in the control group (n = 40) received normal lab-based food, while the mice in the HFD group (n = 40) received an HFD consisting of 18.3% protein, 20.1% carbohydrate and 60.9% fat.(16,17) The ingredients for every 100 g of HFD were milk fat (31.65 g), soya oil (3.22 g), casein (25.84 g), maltodextrine (16.14 g), sucrose (8.9 g), alpha (α)-cellulose (6.5 g), potassium citrate (2.1 g), dicalcium phosphate (1.7 g), L-cysteine (0.37 g), calcium carbonate (0.7 g), choline chloride (0.24 g), mixed vitamins (1.27 g) and mixed minerals (1.27 g),(16,17) making up the aforementioned percentages of protein, carbohydrate and fat. The energy received by each group of mice was measured by weighing the mice every two weeks.
At the end of 12 weeks, the mice in Group 1 (i.e. 20 mice from the HFD group and 20 mice from the control group) were superovulated with 10 IU pregnant mare serum gonadotropin (PMSG). About 44–45 hours later, the mice were sacrificed by cervical dislocation. Germinal vesicle (GV) oocytes were obtained from the superovulated mice for IVM assessment. The mice in Group 2 (i.e. 20 mice from the HFD group and 20 mice from the control group) were given an injection of 10 IU PMSG for follicle development at the end of 12 weeks. A secondary injection of 10 IU human chorionic gonadotropin (HCG) was administered 46 hours after the first injection. The mice were sacrificed 16 hours later and metaphase II (MII) oocytes were obtained from these mice.
Ovarian tissues were harvested from the sacrificed mice. The tissues were fixed in 10% neutral formalin and embedded in paraffin blocks. Sections measuring 5 μ in thickness were obtained, deparaffinised and stained with haematoxylin and eosin. The sections were cut around the centre, along the long axis of the ovary. The number of ovarian follicles and corpora lutea in each section were counted. The follicles observed were classified into four groups: (a) primordial follicles – the oocyte is closely surrounded by a single layer of squamous granulosa cells; (b) primary follicles – the growing oocyte is surrounded by a single layer of cuboidal cells, or a multilayered mass of granulosa cells together with theca cells; (c) secondary (pre-antral) follicles – the oocyte is surrounded by several layers of granulosa cells together with theca cells and is adjacent to a single large antrum; and (d) Graafian (antral) follicles – the oocyte is surrounded by cumulus oophorus cells, and is adjacent to a single large antrum (
Fig. 1
Photomicrographs of ovarian follicles show (a) an ovary section, with a primordial follicle (arrow) (Haematoxylin & eosin, × 4); (b) a primary follicle (white arrow) and a secondary follicle (black arrow) (Haematoxylin & eosin, × 10); and (c) a Graafian follicle (Haematoxylin & eosin, × 10).
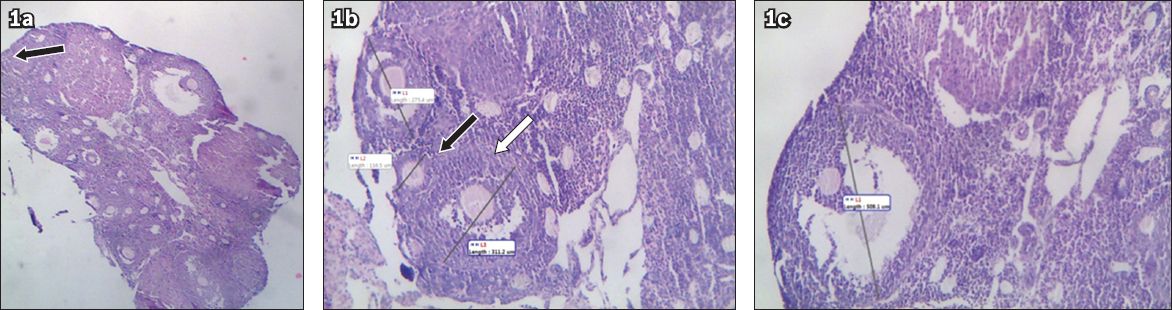
The average number of follicles (including all four groups of follicles) and the average number of corpora lutea in five sections of the ovary (Cf) was counted according to the method described by Tanaka et al.(18) The volume of the ovary (Vo) was calculated using half of the long axis (in µm; a) and half of the short axis (in µm; b) of the ovary. The volume of the section (Vs) was calculated using the long and short axes, and the thickness of a section (i.e. 5 µm). The thickness of the ovary (in µm; c) and the maximum diameter of the follicles (Df) in each section were measured. The number of follicles (Nf) was determined using the following formulae:
The diameter of each counted follicle and corpus luteum was measured using the Motic Images Plus 2.0 software (Micro-Optic, Motic China Group Co Ltd, Xiamen, China). The total number of each type of follicle was calculated (based on the aforementioned formulae) and the results were expressed in percentages.
For IVM assessment, GV oocytes were obtained from the mice in Group 1, which were superovulated with 10 IU PMSG at the end of 12 weeks. Cumulus-oocyte complexes (COCs) were retrieved directly from the follicles under a stereomicroscope, using two 27-gauge needles. The IVM medium consisted of Alpha-Minimum Essential Medium Eagle (α-MEM) supplemented with 5% fetal bovine serum (GIBCO, Invitrogen, Darmstadt, Germany). All the collected GV oocytes were placed in 50 μL microdrops of α-MEM supplemented with 5% fetal bovine serum and overlaid with embryo-tested light mineral oil (Sigma-Aldrich Co, Buchs, Switzerland) for 14–16 hours, in a humidified atmosphere of 5% carbon dioxide at 37°C. The oocytes were observed at regular intervals using an inverted microscope; morphological changes in the nucleus or extrusion of the first polar body were used as the criterion for nuclear maturation of the GV oocytes (i.e. MII oocytes) (
Fig. 2
Microscope photograph shows mouse germinal vesicle oocytes that have matured to the metaphase II stage.
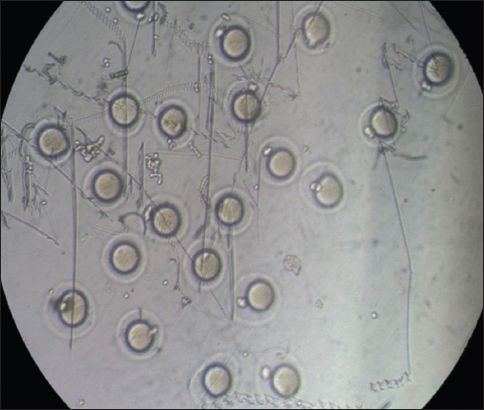
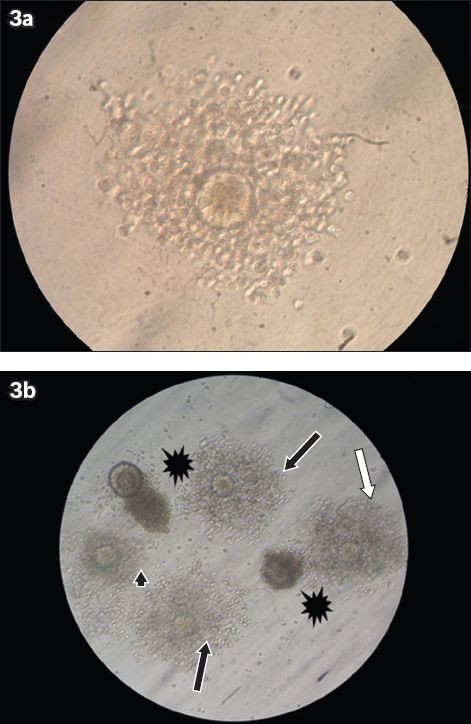
Fig. 3
Microscope photographs show (a) good cumulus expansion (× 40); and (b) good (black arrows), moderate (white arrow) and weak (arrowhead) cumulus expansions, and cumulus degeneration (*) (× 10).
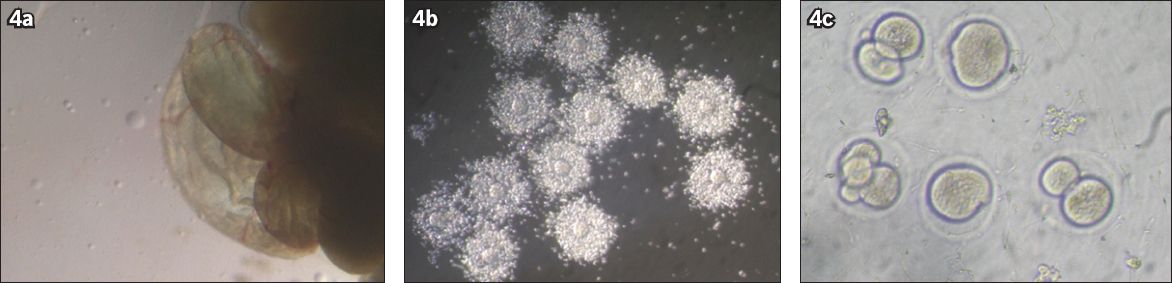
MII oocytes were obtained from the fallopian tubes of the mice in Group 2 (Figs.
Fig. 4
Microscope photographs show (a) the part of a mouse fallopian tube that contains metaphase II (MII) oocytes; (b) cumulus-oocyte complexes containing MII oocytes; and (c) fertilised oocytes, some of which have developed to the two-cell zygote stage.
To check for gene expression, the GV and MII oocytes from both the HFD and control groups that underwent the IVM and IVF methods were gathered. The MII oocytes were denuded of their cumulus cells using hyaluronidase. A minimum of 20 oocytes were collected and placed in 300 µL TRIzol and the collected oocytes were stored at –80°C until use. To evaluate gene expression of BMP15, leptin receptor and glyceraldehyde 3-phosphate dehydrogenase (GAPDH; reference gene), total RNAs were extracted using the chloroform-isopropanol method. From the extracted RNA samples, 2 μL was analysed using the Epoch Microplate Spectrophotometer (BioTek, Winooski, VT, USA).
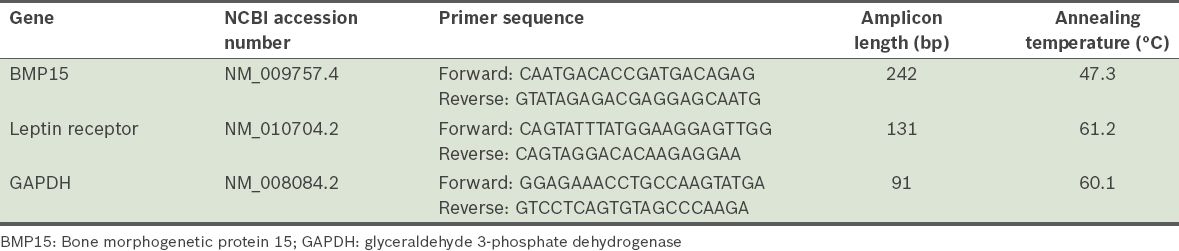
Single-stranded cDNA was synthesised using an AccuPower RT PreMix Kit (Bioneer, Seoul, Korea) with 1 µg of RNA, according to the manufacturer’s protocol. The process included incubation of the reaction mixture at 20°C for 30 seconds, followed by 5 minutes at 44°C, 30 seconds at 55°C and 5 minutes at 95°C. Quantitative real-time polymerase chain reaction (PCR) analyses were performed using the C1000 Thermocycler, CFX96 Real-Time System (Bio-Rad, Hercules, CA, USA) and the QuantiFast SYBR Green PCR Kit (Qiagen, Seoul, Korea), in a final volume of 25 μL with 10 pmol of each primer. The reaction was incubated at 95°C for 5 minutes, followed by 40 cycles of 15 seconds at 95°C, 30 seconds at annealing temperature and 30 seconds at 72°C. Fluorescence was then measured. Each assay was run in triplicate with each set of primers. Primer pairs for the amplification of cDNA coding for BMP15, leptin receptor and GAPDH were designed using information from the GenBank databases, and the AlleleID 6.0 software (Apticraft Systems Pvt Ltd, Madhya Pradesh, India) was used to check and ensure that there was minimum overlap. Information regarding the sequence of the primers, gene accession numbers, annealing temperature and product length is shown in
Table I
Characteristics of the primers used in real-time polymerase chain reaction.
Cycle threshold (Ct) values were obtained using the auto Ct function. Following efficiency correction, the mean value of Ct was calculated and then normalised to the reference gene (GAPDH) using ΔCt. Changes in relative expression were calculated using 2-ΔΔCt. The specific transcripts were presented as a fold-change. Data was analysed using SPSS version 16.0 (SPSS Inc, Chicago, IL, USA). Data regarding animal weight and ovarian follicle count were examined using the χ2 test. IVF and IVM results were evaluated using binomial and χ2 tests. Gene expression data was analysed using the independent t-test. A p-value ≤ 0.05 indicated statistical significance.
RESULTS
At the end of the 12 weeks, the mean weight gain of the mice from the HFD group was 4.65 g ± 0.30 g, while that of the mice from the control group was 5.49 g ± 0.33 g (
Table II
Mean body weight of the mice in the high-fat diet (HFD) and control groups.
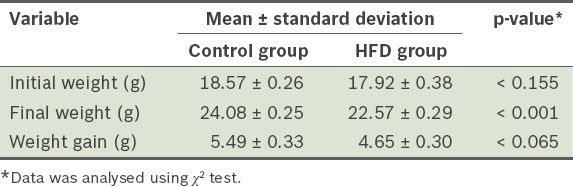
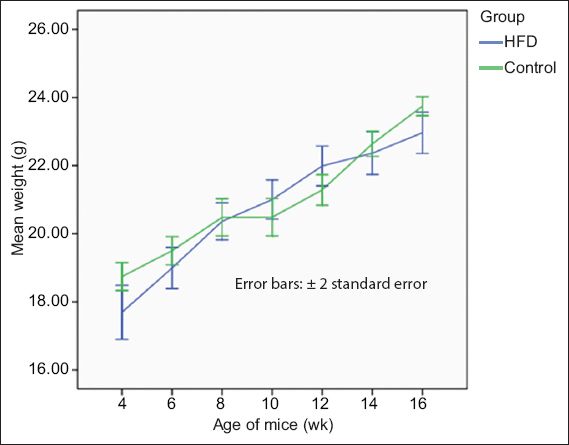
Fig. 5
Graph shows the changes in the mean body weights of the mice in the high-fat diet (HFD) and control groups over the 12 weeks.
The number of primordial and Graafian follicles from the mice in the HFD group was significantly lower than that from the mice in the control group (p < 0.001), while the number of primary and secondary follicles from the mice in the HFD group were significantly higher than that in the control group (p = 0.034) (
Table III
Proportions of the follicles and corpora lutea found in the ovaries of the mice after 12 weeks.
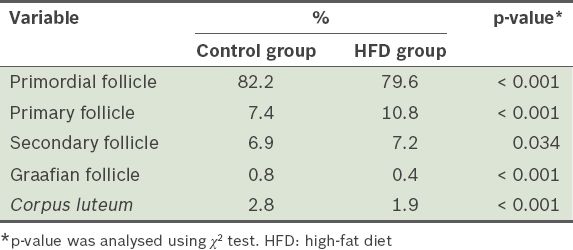
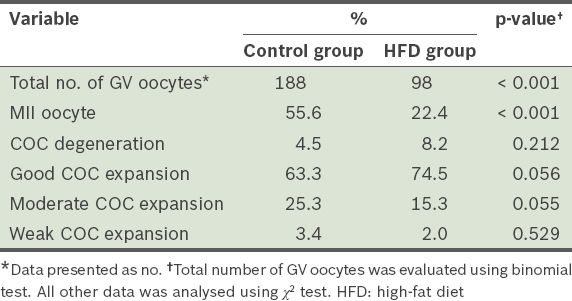
Table IV
Proportions of germinal vesicle (GV) oocytes that matured to the metaphase II (MII) stage, and cumulus-oocyte complex (COC) degeneration and expansion after 12 weeks.
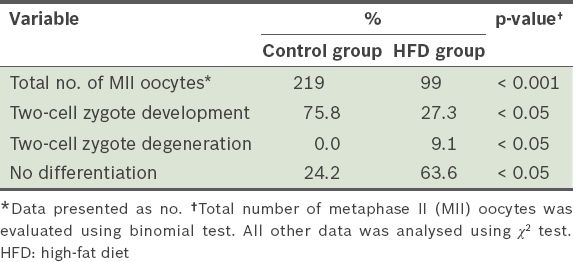
When the MII oocytes were analysed, we found that the number of MII oocytes in the HFD group was significantly lower than that in the control group (p < 0.001) (
Table V
The rates of in vitro fertilisation, and two-cell zygote development and degeneration after 12 weeks.
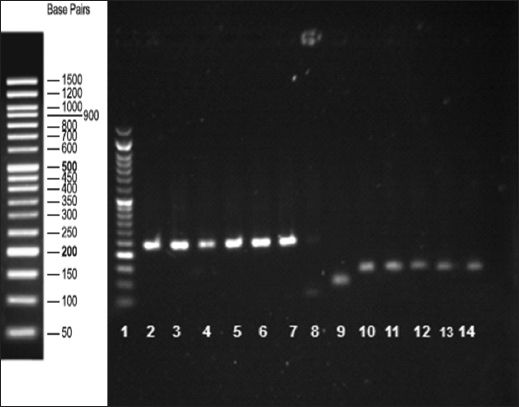
To evaluate the effect of HFD on BMP15 and leptin receptor gene expression in GV and MII oocytes, the mRNA of these oocytes was analysed using quantitative real-time PCR. When compared to the GV oocytes of the control group, the expression of BMP15 and leptin receptor genes was found to be upregulated in the GV oocytes of the HFD group (p > 0.05). BMP15 and leptin receptor levels were increased by 1.1- and 0.9-fold, respectively, after normalisation with GAPDH. In the MII oocytes, the expression of the BMP15 and leptin receptor genes was higher in the HFD group than in the control group (p < 0.05); the expression levels of BMP15 and leptin receptor genes were increased by 15- and 60-fold, respectively. The PCR products of the BMP15 and leptin receptor genes are shown in
Fig. 6
Agarose gel electrophoresis of the real-time PCR products confirms the presence of the amplification products. Lane 1: DNA-ladder; lanes 2–7: BMP15 gene (242 bp); lane 8: negative control; lane 9: GAPDH (positive control, 91 bp); lanes 10–14: leptin receptor gene (131 bp).
DISCUSSION
Maternal obesity is well known to have a negative impact on fertility. The present study used a BALB/c mouse model to examine the impact of HFD on ovary morphology, IVM, IVF and oocyte quality. We found that the number of primordial and Graafian follicles decreased, while the number of primary and secondary follicles increased in the HFD group. This may be because the growth process of primordial follicles is independent of pituitary gonadotropins. There is evidence that the follicle cells in mice stimulate oocyte growth through paracrine factors.(19) In addition, reciprocal regulation of granulosa cell growth by the oocyte probably occurs.(20) In the present study, the number of Graafian follicles decreased in the HFD group. The mechanism for this decrease could be a direct effect on the hypothalamic-pituitary axis.(21) The HFD induces complex changes in the regulation of the different components of the hypothalamus-pituitary axis.(22)
Cordier et al’s study on an obese female rabbit model (induced by feeding rabbits an HFD [83% fat]) showed that, when compared to the control group, the rabbits in the HFD group had a higher number of atretic follicles and a lower number of antral follicles.(23) In the present study, we showed that the maturation rate of the GV oocytes from the HFD group was significantly lower than that of the control group. It has been shown that an HFD could be associated with a rise in the level of reactive oxygen species in the COC, as well as glutathione depletion in preovulatory oocytes and zygotes of female mice.(24) There was also a significant decrease in the number of MII oocytes in the HFD group in the present study. This finding is supported by similar studies that report decreased numbers of MII oocytes in mice with HFD-induced obesity.(25)
In the present study, the IVF results suggest that an HFD affects both the quality and quantity of the oocytes. Compared to the control group, the HFD group had a reduced number of MII oocytes collected from the fallopian tube and a reduced number of fertilised oocytes that differentiated to the two-cell zygote stage. There was also increased oocyte degeneration and an increased number of non-differentiated cells. All these observed changes negatively affect fertility.
Leptin is a protein hormone that is produced primarily by adipose tissue. The leptin receptor is a transmembrane receptor containing the glycoprotein 130 subunit; this subunit is also present in the interleukin 6 receptor and is found in many tissues, including those of the hypothalamus, lung, kidney and ovary.(26) The results of the present study show that the expression of leptin receptor mRNA was increased in the GV and MII oocytes of the HFD group. This finding supports the study by Lange-Consiglio et al, which showed that the expression of leptin receptor mRNA and the rate of oocyte maturation may be related to obesity.(27) Studies using real-time PCR have shown that leptin receptor mRNA is found in the human ovary.(28) Mutations in the obese (ob) gene or the leptin receptor gene have been shown to result in obesity and infertility.(27) Therefore, we can conclude that Leptin exerts direct effects on all ovarian cells and appears to have a physiological regulatory effect in folliculogenesis.
BMP15 is a well-known soluble growth factor that is derived from oocytes; it is important for normal cumulus cell function and hence normal oocyte development.(29) The results of the present study show that the expression of BMP15 mRNA increased in the GV and MII oocytes of the HFD group. We also found that there was a higher number of cumulus expansions in the HFD group. These findings are supported by Su et al’s study, which reported that cumulus expansion was impaired in BMP15 mutant mice.(29)
To conclude, based on the findings of the present study, the probable mechanisms of obesity-associated reproductive and developmental failure are an altered number of primodial and Graafian follicles, an altered number of corpora lutea, and an altered rate of GV oocyte development, IVF, cumulus expansion, BMP15 gene expression and leptin receptor gene expression.
ACKNOWLEDGEMENTS
The authors would like to express their gratitude to Elham Tohidnegad of the Department of Biostatistics and Epidemiology, Hamadan University of Medical Sciences, Hamadan, Iran, for her help in performing the statistical analysis in the present study.