

Abstract
Sclerosing angiomatoid nodular transformation (SANT) is an exceedingly rare, benign and proliferative vascular lesion that arises from the splenic red pulp. It is often an incidental finding on imaging. The diagnosis of SANT is confirmed via histopathological examination of the resected spleen. Herein, we present a case of SANT and describe its typical imaging characteristics. An asymptomatic 39-year-old man was found to have a 3.1 cm × 2.7 cm × 2.3 cm hypoechoic splenic lesion during abdominal ultrasonography, which was performed to investigate his elevated gamma-glutamyl transpeptidase and alanine transaminase levels. Contrast-enhanced computed tomography suggested a vascular splenic lesion, while magnetic resonance imaging demonstrated features consistent with SANT. In view of the increasing size of the lesion on follow-up imaging, the patient elected for splenectomy. Histopathological examination confirmed SANT, and the lesion was completely resected by laparoscopic splenectomy.
INTRODUCTION
Sclerosing angiomatoid nodular transformation (SANT) is an exceedingly rare tumour of the spleen. The term was first introduced by Martel et al in 2004 to describe a group of morphologically distinct vascular lesions of the spleen.(1) These lesions, which are benign, non-neoplastic and vascular in nature, can be completely resected by splenectomy. Approximately 50 cases of SANT have been reviewed in the literature that is available in English.(1-6) To the best of our knowledge, this is the first case of SANT in which the lesion was observed to increase in size over time.
CASE REPORT
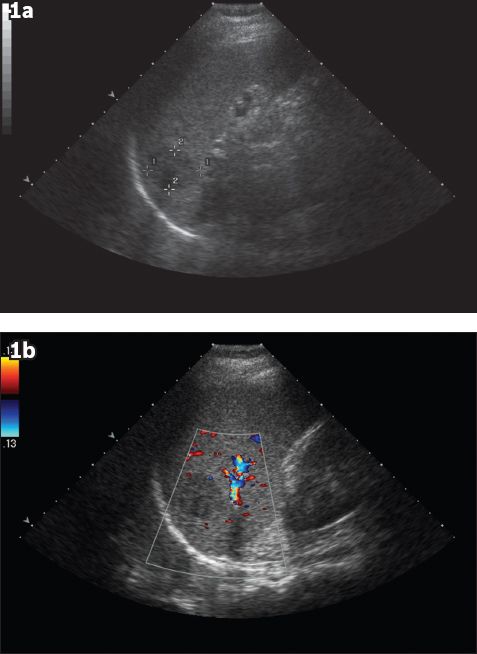
Our patient, a 39-year-old man, was found to have raised gamma-glutamyl transpeptidase (247 µ/L) and alanine transaminase (45 µ/L) levels during a private medical health screening session in August 2011. Initial ultrasonography (US) performed was unremarkable aside from a 3.1 cm × 2.7 cm × 2.3 cm well-defined hypoechoic lesion in the spleen (
Fig. 1
(a) Initial US image shows a well-defined hypoechoic lesion in the spleen, measuring 3.1 cm at its largest dimension. (b) Initial Doppler US image shows no appreciable vascularity of the lesion.
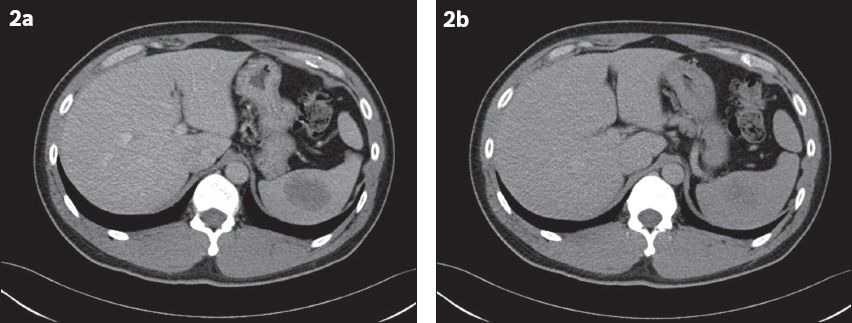
On follow-up US in December 2012, the hypoechoic splenic lesion showed an interval increase in size, measuring 4.0 cm × 3.9 cm × 3.0 cm. Contrast-enhanced computed tomography (CT) was performed, and a well-defined, ovoid hypoattenuating lesion measuring 4.6 cm × 3.4 cm (in axial dimensions) was seen in the spleen during the portal venous phase, with ‘filling in’ of contrast and increasing homogeneity to the splenic parenchyma in the delayed phase (
Fig. 2
At one-year follow-up. (a) Contrast-enhanced CT image in the portal venous phase shows a well-defined ovoid hypoattenuating lesion measuring 4.6 cm × 3.4 cm (in axial dimensions). (b) Delayed CT image shows increased homogeneity of the lesion.
On MR imaging, the lesion was noted to be entirely within the spleen. On T1-weighted sequences, the lesion appeared isointense to the splenic parenchyma (
Fig. 3
At one-year follow-up. (a) Contrast-enhanced T1-W MR image shows a lesion that is isointense to the splenic parenchyma. (b) T2-W, fat-saturated MR image shows the lesion to be mildly hypointense, with a central increasingly hypointense stellate focus, similar to the ‘spoke-wheel’ configuration described in previous case reports.
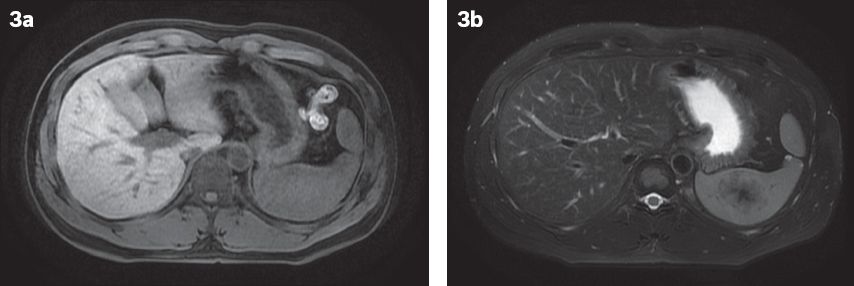
Fig. 4
MR images following the administration of intravenous contrast agent. (a) Arterial phase post-contrast-enhanced T1-W, fat-saturated MR image shows early peripheral enhancement. (b) Post-contrast three-minute delayed MR image shows centripetal filling. (c) Post-contrast five-minute delayed MR image shows progressive centripetal filling, with a persistent nonenhancing central hypointense focus.

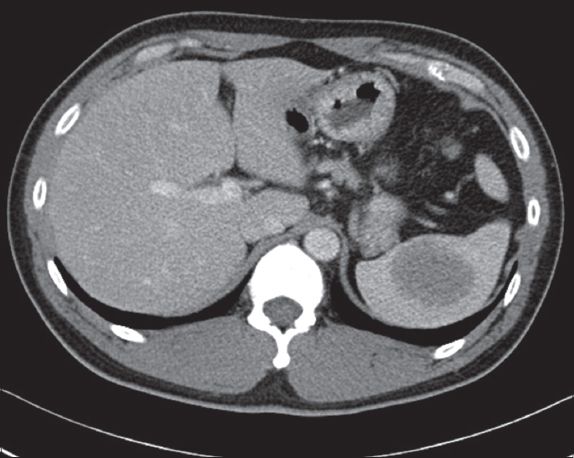
Fig. 5
Follow-up contrast-enhanced CT image taken six months after MR imaging shows that the lesion has further increased in size to 4.9 cm × 4.0 cm (in axial dimensions).
The patient elected to undergo laparoscopic splenectomy. Surgery was performed under general anaesthesia with the patient in the supine position. Infraumbilical, left hypochondrium midclavicular line and left hypochondrium anterior axillary line incisions were made for ports. The entire spleen was delivered via a periumbilical midline incision. The removed spleen measured 11.0 cm × 9.0 cm × 7.0 cm and weighed 277.2 g. Macroscopically, a well-circumscribed tumour measuring 5.0 cm × 4.5 cm × 4.5 cm was identified; it had a central area of fibrosis that was surrounded by peripheral dark reddish areas. The closest distance to the splenic capsule measured less than 0.1 cm. No other splenic lesion was identified.
On microscopy, the tumour was composed of hypocellular fibrosclerotic areas, with scattered bland spindled myofibroblastic and fibroblastic cells, and few associated lymphocytes and plasma cells. No necrosis or mitosis was evident and obliterative phlebitis, granulomas or follicular dendritic cell proliferation was not observed. Irregular to nodular vascular areas resembling splenic red pulp were interspersed between the areas of sclerosis. These vascular areas were made of residual sinusoids and a complex network of cord capillaries, which were associated with many extravasated red blood cells and surrounded by vaguely concentric layers of hyalinised collagen bundles at the periphery (Figs.
Fig. 6
Photomicrograph shows the circumscribed splenic tumour with prominent areas of sclerosis (pink zones) punctuated by nodular vascular areas (arrows); an adjacent rim of normal splenic tissue is seen on the right (Haematoxylin & eosin, × 20).
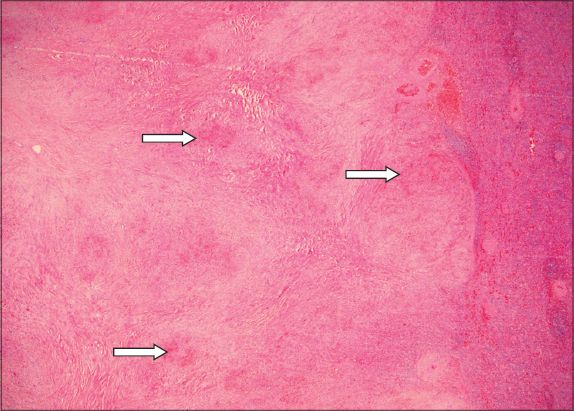
Fig. 7
Photomicrograph shows a nodular vascular area comprising sinusoids and slit-like, capillary-sized vessels lined by bland endothelial cells; the area is associated with many extravasated red blood cells and cuffed by a layer of fibrosis at the periphery (Haematoxylin & eosin, ×100).

DISCUSSION
SANT is an exceedingly rare, benign and vascular lesion of the spleen. Since it was first described by Martel et al in 2004,(1) approximately 50 cases have been mentioned in the English literature.(1-6) While its pathogenesis has yet to be fully understood, Martel et al suggested that the nodules in SANT are derived from splenic red pulp and that they arise due to nodular transformation.(1) They postulate that the nodular transformation occurs in response to an exaggerated non-neoplastic stromal proliferation, resulting in outflow disruption of the small vascular tracts and subsequent nodular or hyperplastic changes of the proximal vascular tract.(1) As SANT comprises splenic red pulp, it may also be considered a peculiar form of splenic hamartoma.
The mean age at presentation for SANT is 53.7 (range 22–74) years.(3) There is female predominance, with a female-to-male ratio of 2:1.(1) The resected spleen is usually normal in size or mildly enlarged, with a mean weight of 386 (range 68–1,425) g.(3) The lesion usually ranges from 3 cm to 17 cm in diameter.(1,7) As most patients are asymptomatic, the splenic mass is often an incidental finding during laparotomy or on imaging studies performed for unrelated conditions. Approximately 16% of patients with SANT complain of discomfort or abdominal pain.(3) A small proportion of patients present with splenomegaly, which has rarely been associated with leucocytosis, polyclonal gammopathy and increased erythrocyte sedimentation rate.(1) Splenectomy is considered curative, with no case of recurrence reported following surgical resection of SANT.(1-6)
SANT has a distinctive macroscopic appearance. It is a well-circumscribed, non-encapsulated mass composed of numerous nodules derived from splenic red pulp, with alternating bands of dense fibrous tissue that coalesce to form a central, stellate fibrous scar.(1,8) The nodules usually vary in size, are round- or oval-shaped, and may be surrounded by dense concentric collagen fibres or a fibrin rim (resulting in a granuloma-like or necrotising vasculitic appearance).(3)
Microscopically, SANT is identified by multiple nodular aggregates of plump endothelial cells and prominent slit-like vascular spaces that are lined by pericytes.(1-3,7) The nodules are associated with extravasated erythrocytes. The intervening collagenous stroma between the nodules contains a variable number of reactive myofibroblasts, haemosiderin-laden macrophages, lymphocytes and plasma cells. The endothelial cells exhibit minimal cytologic atypia, and mitotic activity is rarely observed.(1-3,7) Preoperative diagnosis of SANT is usually difficult, and a confirmatory diagnosis is often achievable only with postoperative histopathologic examination.(9)
In one reported case of SANT, a percutaneous core biopsy was used for diagnosis, with the caveat that an increased frequency of complications (e.g. haemorrhage and splenic rupture) was noted following percutaneous biopsies of vascular splenic lesions.(8,10) An immunostained SANT specimen typically shows the presence of sinusoidal, capillary-like and vein-like elements within the nodules.(1) Some vessels may be lined by CD34–/CD31+/CD8+ endothelial cells that are similar to splenic sinusoidal lining cells, while other vessels are capillary-like (with endothelial cells showing a CD34+/CD31+/CD8- phenotype) or small vein-like (with CD34–/CD31+/CD8– endothelium).(3) Focal expression of CD68 within the nodules may be seen, indicating an active phagocytic process in response to increased splenic activity(7); this further reinforces the non-neoplastic nature of SANT.
Abdominal US of SANT usually reveals a hypoechoic splenic lesion, although the lesion appeared isoechoic in one out of five patients in a case report.(8) A ‘spoke-wheel’ pattern may be observed on contrast-enhanced US.(11) On unenhanced CT, the lesion usually appears heterogeneously hypoattenuating with circumscribed margins. Peripheral rim-style enhancement of the external borders of the lesion is observed following intravenous administration of a contrast medium. On delayed CT, the lesion shows more homogeneous enhancement.(12)
On MR imaging, an increase in signal on the out-of-phase T1 sequence may suggest the presence of iron, which in SANT, is likely due to the haemorrhagic nature of the lesion.(13) T2-weighted MR imaging typically shows peripheral hypointensity with a central hypointense focus. Following intravenous administration of a contrast medium, a persistent low-central signal on T1- and T2-weighted images, with progressive enhancement from the periphery to the centre of the lesion, is usually seen; this is concordant with the gross pathologic appearance of a central fibrous stroma and peripheral nodules of angiomatoid tissue.(11)
In evaluating vascular lesions, differentials for SANT would include splenic haemangioma, splenic haemangioendothelioma, inflammatory myofibroblastic tumour and splenic hamartoma. However, the presence of a characteristic hypointense central stellate scar alludes to a diagnosis of SANT. While the ‘spoke-wheel’ pattern has been characteristically described,(14) it is not seen in all patients with SANT.(8) Increased tracer uptake by SANT on fluorodeoxyglucose-positron emission tomography suggests hypermetabolic activity and fluorodeoxyglucose avidity, both of which may be due to the presence of haemosiderin-laden macrophages, myofibroblasts and plasma cells. In SANT, no uptake of Technetium-99m (99 mTc)-sulphur colloid is seen on 99 mTc-sulphur colloid single-photon emission CT due to the absence of reticuloendothelial cells.(13)
In conclusion, we described a rare case of SANT of the spleen and its imaging findings on US, CT and MR imaging. The patient in this case study was asymptomatic and elected for laparoscopic splenectomy. To the best of our knowledge, this is the first case of SANT in which the size of the lesion increased over time.